Real user monitoring for Core Web Vitals, set up by your AI agent
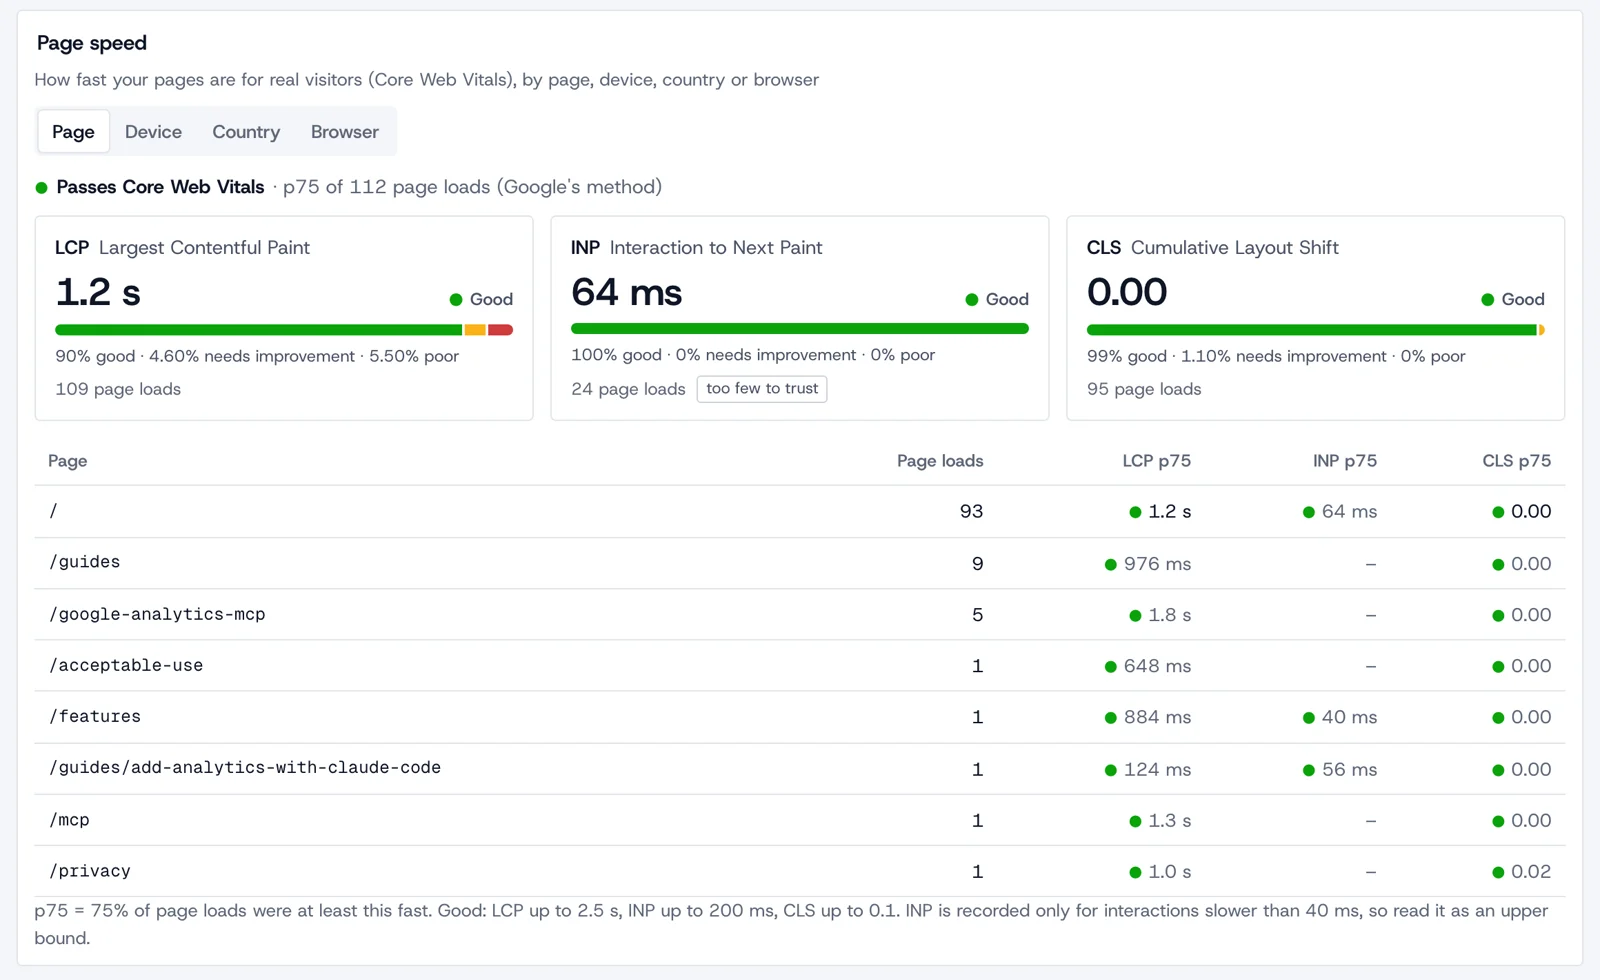
AgentFirstStack Page speed measures Core Web Vitals in your real visitors' browsers: LCP, INP and CLS of each full page load, reported at the 75th percentile the way Google measures them, by page, device, country and browser, slowest pages first. It's part of AgentFirstStack Analytics, so the tracker you already load sends it. It does the Core Web Vitals job of PageSpeed Insights' field data, Vercel Speed Insights and SpeedCurve's RUM, free and open source, and an AI agent sets it up, tests it and reads it over REST and MCP. It's real user monitoring for page speed, not APM: no backend traces, server timings or error tracking.
Set it up with one prompt
Paste this into your coding agent. Real-visitor numbers need visits, so on a new site the prompt has your agent run a lab test first and tell you when the field data will be worth reading.
Measure this site's Core Web Vitals from real visitors with AgentFirstStack Analytics. It's free, open-source analytics built for agents, its tracker reports LCP, INP and CLS for every page load, and you can do the setup yourself: there is no signup form. 1. Read https://agentfirststack.com/llms.txt and https://analytics.agentfirststack.com/llms.txt (the "Page speed" section). 2. If this project's .env already has AGENTFIRSTSTACK_API_KEY, use it and read AGENTFIRSTSTACK.md. Otherwise get a key: curl -X POST https://agentfirststack.com/v1/signup, and save api_key in .env as AGENTFIRSTSTACK_API_KEY and in the production secrets. 3. Use the analytics site in AGENTFIRSTSTACK.md, or create one for the production domain. Serve the tracker from our own domain: a first-party domain (POST https://agentfirststack.com/v1/first-party-domains with a neutral subdomain; add the CNAME if you can change our DNS, otherwise give me the record) or, meanwhile, the path proxy from GET /v1/sites/:id/install. Put the tracker in the head of every page. 4. Deploy, open a few pages in a normal browser, and run verify. If the site already runs another speed tool (Vercel Speed Insights, SpeedCurve, a web-vitals script), tell me and leave it in place. 5. Run a lab test on the homepage and our main landing page with GET /v1/sites/:id/web-vitals/lab?strategy=mobile, and show me lab, Google's field data and our real visitors side by side. 6. Read GET /v1/sites/:id/web-vitals?breakdown=page, then breakdown=device. If a metric has fewer than 30 page loads, say so and tell me when to look again. For each failing metric, list the pages and the fix you'd make first, and ask me before you change code. 7. Add a web_vitals alert for LCP on mobile to an email destination for me, and write the site id and the env var name (never the key) in AGENTFIRSTSTACK.md. Create a claim link for me with POST https://agentfirststack.com/v1/claim-link. Tell me what you set up, what verify and the lab test returned, what's waiting on me, and give me the claim link.
What your agent does
- Gets a key with one request,
curl -X POST https://agentfirststack.com/v1/signup, and saves it in.envasAGENTFIRSTSTACK_API_KEY, or reuses the one there. - Creates the analytics site:
POST https://analytics.agentfirststack.com/v1/sites {"domain":"example.com"}(MCPanalytics_create_site). Page speed has nothing else to turn on. - Serves the tracker from your domain: a first-party domain,
POST https://agentfirststack.com/v1/first-party-domains {"hostname":"edge.example.com"}(MCPafs_add_first_party_domain), with one CNAME tofp.agentfirststack.com, or the path proxy fromGET /v1/sites/:id/install. Ad blockers block analytics hosts, and a blocked tracker sends no vitals either. - Adds the snippet,
<script defer src="https://edge.example.com/_a/s.js" data-site="site_...">, to the<head>of every page, deploys, and runsPOST /v1/sites/:id/verify(MCPanalytics_verify_install). - Reads real visitors' vitals:
GET /v1/sites/:id/web-vitals?period=30d&breakdown=page(MCPanalytics_get_web_vitals), thenbreakdown=device, because Google assesses mobile and desktop separately. - Runs a lab test on the slowest page:
GET /v1/sites/:id/web-vitals/lab?url=https://example.com/pricing&strategy=mobile(MCPanalytics_get_web_vitals_lab). - Sets an alert:
POST /v1/sites/:id/alerts {"name":"Slow LCP on mobile","type":"web_vitals","metric":"lcp","filters":"device==mobile","destination_ids":["dst_..."]}(MCPanalytics_create_alert), by email, Slack or webhook. - Hands over a claim link (
POST https://agentfirststack.com/v1/claim-link): you sign in with Google and see the Page speed panel in the dashboard.
What you get
- Three Core Web Vitals from each full page load: LCP (the last largest-contentful-paint candidate), INP (the slowest interaction) and CLS (the largest 5-second window of layout shifts). They ride on the beacon the tracker sends when a visitor leaves or hides the page; no second script.
- Google's method: per metric, the 75th percentile of page loads by nearest rank, the share of page loads that are good, need improvement or are poor, and an assessment: passed, failed or not enough data. Fewer than 30 page loads and the answer says the p75 is rough.
- Breakdowns: by page, device, country or browser, the most-loaded first; filters such as
device==mobileorpage==/checkout*, saved segments, and comparison with the previous period or last year.lcp_p75,inp_p75andcls_p75are also stats metrics, so any other breakdown (operating system, channel, campaign) can carry them. - Slowest pages first: among the 100 most-loaded pages, the ones whose worst metric is furthest over its good limit, and
coverage: how many pageviews carried vitals. - Next steps: what usually fixes each failing metric, naming its worst pages, in every answer.
- A lab run through Google's PageSpeed Insights, next to both kinds of field data (below).
- Alerts: a
web_vitalsalert fires when a metric's p75 over a window (default 1 day) goes over its threshold (default Google's good limit) with at least 30 page loads, and lists the slowest pages. - Raw values: each pageview's
lcp,inpandclsin the event export and read-only SQL.
How the numbers are measured
The tracker reads the browser's own performance entries during each full page load. Client-side navigations in a single-page app carry no vitals, because the three metrics describe a page load. Thresholds are Google's: LCP is good up to 2.5 s and poor over 4 s, INP good up to 200 ms and poor over 500 ms, CLS good up to 0.1 and poor over 0.25. A site passes when every metric with enough page loads is good and LCP and CLS have enough; INP needs an interaction, so some page loads have none.
The dashboard prints one caveat under the table: "INP is recorded only for interactions slower than 40 ms, so read it as an upper bound." Page loads whose interactions all answered faster than 40 ms report no INP, so the p75 is taken over the slower ones and the true figure is at most that. The tracker also keeps the single slowest interaction, where Google's INP ignores one highest interaction for every 50 on very busy pages.
Browsers report what their performance APIs support, so some visitors send fewer than three metrics or none. Each metric's sample count says how many page loads it rests on.
Lab tests: a PageSpeed Insights run
GET /v1/sites/:id/web-vitals/lab asks Google's PageSpeed Insights API to run Lighthouse on one https page of the site's domain or its subdomains, strategy=mobile (default) or desktop, with Lighthouse's performance category only. One call returns:
lab: the performance score, LCP, CLS, Total Blocking Time (the lab stand-in for INP, since a lab run has no real interactions), FCP, Speed Index and server response time.opportunities: up to 6 audits with their estimated savings, biggest first.google_field: Google's Chrome UX Report p75 for the URL, or the whole origin when the URL has too little data, over the last 28 days; null when Google has none.real_visitors: our own p75 for the same path over the last 30 days.
A run takes 10 to 45 seconds and needs a full-access key, because Google fetches the page on your behalf. Your agent runs it when it needs it; it isn't scheduled, and it doesn't return Lighthouse's accessibility, best practices or SEO audits.
What the setup check verifies
The setup check (GET https://agentfirststack.com/v1/setup, MCP afs_check_setup) has no page-speed check of its own: vitals arrive with the tracker, so the analytics checks cover them.
| Check | What it means here |
|---|---|
analytics.site | Analytics has a site for the website |
analytics.receiving | Analytics is receiving events from the pages, from browsers as well as servers |
analytics.domain_verified | The site's domain is verified: verify found the snippet on the live homepage, or the DNS record |
analytics.first_party | Browser events arrive first-party, through the site's own domain, so ad blockers don't drop them |
analytics.proxy_key | Shown only when it fails: events through a path proxy are missing its proxy key, so countries are wrong |
analytics.alerts | Alerts fire on a traffic drop and when tracking stops (a web_vitals alert is extra; the check doesn't ask for one) |
Whether page loads carry vitals shows in coverage on GET /v1/sites/:id/web-vitals, and its next_steps say what to check when none do.
Compared with
Prices and plans as of 7 November 2026, from each product's own pages; the comparison pages link the sources.
| Field data | Lab tests | Price | Hosting | |
|---|---|---|---|---|
| PageSpeed Insights | Chrome UX Report: eligible Chrome users over 28 days, for pages or origins with enough traffic | Lighthouse: performance, accessibility, best practices, SEO | Free; no sign-in | Any public URL |
| Vercel Speed Insights | Real visitors; the free tier shows the Real Experience Score only, Plus every Core Web Vital | Not its own; a Virtual Experience Score through integrations such as Checkly | Free tier with 10,000 events a team per 30 days; Plus $10 a project a month plus $0.65 per 10,000 events on Pro | Vercel projects |
| SpeedCurve | RUM page views | Synthetic monitoring | From $90 a month (Starter), Growth from $576 | A RUM snippet at the top of the page's head |
| AgentFirstStack | Real visitors: LCP, INP and CLS at p75, by page, device, country and browser | One PageSpeed Insights run on request, performance only | Free hosted service with fair-use limits | Any site that can load a script |
SpeedCurve's figures are from speedcurve.com/pricing, where RUM "collects page views" and Synthetic "collects lab data"; its RUM snippet goes "at the top of the <HEAD> element" (SpeedCurve support). There's no SpeedCurve comparison page yet.
Limits
- 10 analytics sites per project (3 before a person claims it), and 400 days of history kept.
- Lab runs: a few a minute per account and per domain, keyless on Google's shared PageSpeed Insights quota, which can run out (
503 upstream_rate_limited: try again in a few minutes). Self-hosters can set their ownPAGESPEED_API_KEY. - The engagement beacons that carry vitals count toward the analytics daily event budgets;
GET /v1/usageshows what a project has used.
All of them: fair-use limits.
When it isn't the right fit
- You need APM. There are no backend traces, server timings or error rates. For JavaScript errors in the browser, session replay records them.
- You need more than LCP, INP and CLS from real visitors. FCP, TTFB and long-animation-frame data aren't collected from visitors (FCP and server response time come only from a lab run), and the percentile is p75 only, with no p90 to p99.
- You need attribution. It doesn't record which element was the LCP element, which one shifted, or which script made an interaction slow. Vercel Speed Insights Plus shows element selectors.
- Your app is a single-page app and the slow part is client-side navigation: those navigations carry no vitals.
- You need scheduled synthetic tests, from many locations or before each deploy. The lab run is one PageSpeed Insights run when your agent asks; SpeedCurve sells synthetic monitoring.
- You need native app performance. The tracker measures websites.
FAQ
Is this real user monitoring or APM?
Real user monitoring for Core Web Vitals only. It measures how fast your pages load, respond and stay still in visitors' browsers (LCP, INP and CLS). It doesn't trace backend requests, time database queries or collect server errors, so it doesn't replace an APM tool.
Does it measure Core Web Vitals the way Google does?
It uses Google's method and thresholds: per metric, the 75th percentile of page loads by nearest rank, rated good, needs improvement or poor (LCP 2.5 s and 4 s, INP 200 ms and 500 ms, CLS 0.1 and 0.25). The visitors differ: Google's field data comes from eligible Chrome users in the Chrome UX Report, ours from every visitor whose browser reports the metrics, so the numbers won't match exactly.
Why does the dashboard say to read INP as an upper bound?
The tracker records only interactions slower than 40 ms. Page loads whose interactions were all faster report no INP, so the p75 is taken over the slower page loads, and the real p75 is at most that. The tracker also keeps the single slowest interaction, where Google skips one outlier for every 50 interactions on very busy pages.
Does it run Lighthouse lab tests?
Yes, through Google's PageSpeed Insights API, one page at a time when your agent asks: the performance score, lab LCP, CLS, Total Blocking Time, FCP, Speed Index and server response time, the biggest opportunities, Google's field data and our real-visitor p75 for the same page. It asks only for Lighthouse's performance category, and it isn't scheduled.
How many page loads do I need?
30 page loads with a metric before its p75 counts as enough; fewer and the dashboard marks it too few to trust. A page needs 10 to be ranked among the slowest pages. On a quiet site, widen the period, for example to 90 days.
Do I need another script for page speed?
No. The AgentFirstStack Analytics tracker sends LCP, INP and CLS with the beacon it already sends when a visitor leaves a page. Load the current tracker from our service or your first-party domain, not a copy.
Related
- AnalyticsWeb analytics your AI agent sets upThe tracker that sends page speed, and everything else it counts.
- AnalyticsPageSpeed Insights alternativeField data from your own visitors, next to Google's.
- AnalyticsVercel Speed Insights alternativeEvery Core Web Vital, free, on any host.
- AnalyticsAI searchWhich AI crawlers read your pages, and who they send.
- ReplaySession replaySee what a slow page did to a real visit.
- All servicesOne MCP server for every serviceAnalytics, tags, mail and replay tools on one key.